

BETA Beta version. If anything looks wrong, please tell us through the feedback form. Send feedback

As of round 17 Race · updated 10/13/2026, 07:18 PM (Japan time)

Riders

Miguel Oliveira (photo from Wikimedia Commons)
Agência Lusa · CC BY 3.0 · 2022 · Wikimedia Commons

Miguel Oliveira

Nationality
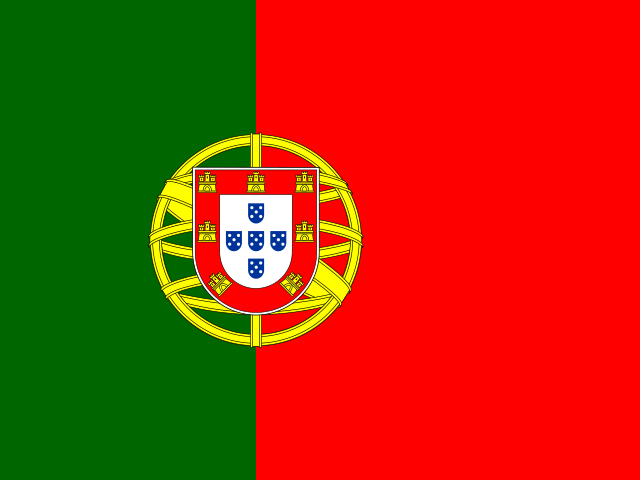
Portugal Portugal
Number
88
Team (2025 MotoGP)
Prima Pramac Yamaha MotoGP
Bike
Yamaha
Born
January 4, 1995(age 31)
Birthplace
Pragal

Birth date and place from the official rider profile

Share Post on X

Career

Made a Grand Prix debut in 125cc at Lusail in 2011.

Read more

In 125cc (2011): 11 starts, 0 wins, 0 podiums. Teams: Andalucia Banca Civica. In Moto3 (2012–2015): 68 starts, 6 wins, 13 podiums. Teams: Estrella Galicia 0'0, Mahindra Racing, Red Bull KTM Ajo. In Moto2 (2016–2018): 50 starts, 6 wins, 21 podiums. Teams: Leopard Racing, Red Bull KTM Ajo. In MotoGP (2019–2025): 117 starts, 5 wins, 7 podiums. Teams: Red Bull KTM Tech 3, Red Bull KTM Factory Racing, CryptoDATA RNF MotoGP Team, Trackhouse Racing, Prima Pramac Yamaha MotoGP.

First podium: Catalunya 2012 (Moto3). First win: Mugello 2015 (Moto3).

In all, 246 Grand Prix starts, 17 wins and 41 podiums (within the official results database).

Written automatically from the official results database (no opinions about the rider)

Season by season

125ccMoto3Moto2MotoGP ★ Champion

1510152020122014201620182020202220242011 125cc: P14 / 44 pts / 0 wins125cc2012 Moto3: P8 / 114 pts / 0 wins2013 Moto3: P6 / 150 pts / 0 wins2014 Moto3: P10 / 110 pts / 0 wins2015 Moto3: P2 / 254 pts / 6 winsMoto32016 Moto2: P21 / 36 pts / 0 wins2017 Moto2: P3 / 241 pts / 3 wins2018 Moto2: P2 / 297 pts / 3 winsMoto22019 MotoGP: P17 / 33 pts / 0 wins2020 MotoGP: P9 / 125 pts / 2 wins2021 MotoGP: P14 / 94 pts / 1 wins2022 MotoGP: P10 / 149 pts / 2 wins2023 MotoGP: P16 / 76 pts / 0 wins2024 MotoGP: P15 / 75 pts / 0 wins2025 MotoGP: P20 / 43 pts / 0 winsMotoGP

The strip shows each year's team (team colour). Tap for team and machine

Scope: official results DB, 2011–2025 (the rider's racing years)

Totals

125cc2011–2011
Win rate0.0%
Podium rate0.0%
Average finish (when classified)avg P10.7

44 pts · Poles 0

Moto32012–2015
Win rate8.8%
Podium rate19.1%
Average finish (when classified)avg P7.3

624 pts · Poles 2

Moto22016–2018
Win rate12.0%
Podium rate42.0%
Average finish (when classified)avg P6.0

574 pts · Poles 2

MotoGP2019–2025
Win rate4.3%
Podium rate6.0%
Average finish (when classified)avg P10.8

564 pts · Poles 1

Sprint

31 pts · Average finish (when classified) avg P12.6

Points are counted per class, never added across classes. Tap a number for the list of races | Scope: official results DB, 2011–2025 (the rider's racing years)

Strongest and weakest circuits

Strong
  1. Catalunya 3.4 places better than usual (6 finishes)
  2. Mandalika 2.8 places better than usual (3 finishes)
  3. Sachsenring 2.0 places better than usual (5 finishes)
Weak
  1. Lusail 3.8 places worse than usual (4 finishes)
  2. Aragón 2.9 places worse than usual (6 finishes)
  3. Red Bull Ring 2.6 places worse than usual (3 finishes)

Each finish here compared with the rider's usual finish that season (average without this circuit): how many places better or worse on average. Same layout only; retirements counted separately

Against the greats, and the class of their debut

Grand Prix debut in 2011. Of the 38 riders who debuted that year, 4 also raced in 2026.

Greats: 2+ world titles or 30+ MotoGP・500cc wins. Up to 4 who shared 10+ races, most titles first. A finisher counts as ahead of a non-finisher.

Results by condition (races)

MotoGP 117 races · 2019–2025

Dry / wet

More podiums in the wet (40.0% wet, 4.5% dry)

Win rate
Dry112 races3%(3 wins)
Wet5 races40%(2 wins)
Podium rate
Dry112 races4%(5 podiums)
Wet5 races40%(2 podiums)
Average finish (when classified)
Dry112 racesavg P11.1
Wet5 racesavg P5.3

By grid position

From Grid 7–9, they move up from an average grid of 7.7 to an average finish of 4.1

average grid average finish (classified)

151015Starting Grid 1–3: average grid 2.0 → average finish 4.0 (3 races, 1 wins)Grid 1–3Starting Grid 4–6: average grid 5.0 → average finish 2.7 (6 races, 1 wins)Grid 4–6Starting Grid 7–9: average grid 7.7 → average finish 4.1 (10 races, 2 wins)Grid 7–9Starting Grid 10–15: average grid 12.9 → average finish 9.7 (47 races, 1 wins)Grid 10–15Starting Grid 16〜: average grid 18.2 → average finish 13.9 (51 races, 0 wins)Grid 16〜
Grid 1–32.0 → 4.01 wins / 3 races
Grid 4–65.0 → 2.71 wins / 6 races
Grid 7–97.7 → 4.12 wins / 10 races
Grid 10–1512.9 → 9.71 wins / 47 races
Grid 16〜18.2 → 13.90 wins / 51 races

By circuit (best average first)Small sample

Best circuit: Mandalika (average P8.0, 3 races)

Mandalika3 racesavg P8.0
Valencia5 racesavg P8.2
Catalunya8 racesavg P8.3
Portimão7 racesavg P9.0
Sachsenring6 racesavg P9.0
Red Bull Ring9 racesavg P10.0
Buriram4 racesavg P10.3
Le Mans6 racesavg P10.5
Assen6 racesavg P10.5
Silverstone6 racesavg P10.5
Mugello6 racesavg P10.8
Misano10 racesavg P11.0
Jerez7 racesavg P11.4
COTA5 racesavg P11.8
Brno3 racesavg P12.0
Termas2 racesavg P12.0
Balaton1 racesavg P12.0
Buddh1 racesavg P12.0
Motegi4 racesavg P12.3
Phillip Island3 racesavg P12.3
Aragón7 racesavg P12.5
Lusail5 racesavg P15.0
Sepang3 racesavg P16.0

MotoGP: all in the Michelin era.

Moto2 50 races · 2016–2018

Dry / wet

Podium rate: 43.2% dry, 33.3% wet

Win rate
Dry44 races11%(5 wins)
Wet6 races17%(1 wins)
Podium rate
Dry44 races43%(19 podiums)
Wet6 races33%(2 podiums)
Average finish (when classified)
Dry44 racesavg P6.1
Wet6 racesavg P5.0

By grid positionSmall sample

From Grid 10–15, they move up from an average grid of 13.0 to an average finish of 6.2

average grid average finish (classified)

151015Starting Grid 1–3: average grid 1.8 → average finish 2.0 (6 races, 2 wins)Grid 1–3Starting Grid 4–6: average grid 4.6 → average finish 3.4 (9 races, 2 wins)Grid 4–6Starting Grid 7–9: average grid 8.1 → average finish 4.6 (11 races, 0 wins)Grid 7–9Starting Grid 10–15: average grid 13.0 → average finish 6.2 (12 races, 2 wins)Grid 10–15Starting Grid 16〜: average grid 18.7 → average finish 11.9 (12 races, 0 wins)Grid 16〜
Grid 1–31.8 → 2.02 wins / 6 races
Grid 4–64.6 → 3.42 wins / 9 races
Grid 7–98.1 → 4.60 wins / 11 races
Grid 10–1513.0 → 6.22 wins / 12 races
Grid 16〜18.7 → 11.90 wins / 12 races

By circuit (best average first)Small sample

Best circuit: Jerez (average P2.5, 3 races)

Sepang2 racesavg P1.5
Jerez3 racesavg P2.5
Sachsenring3 racesavg P3.0
Buriram1 racesavg P3.0
Catalunya3 racesavg P4.3
Brno3 racesavg P4.3
COTA3 racesavg P4.5
Valencia3 racesavg P5.0
Aragón2 racesavg P5.0
Motegi2 racesavg P5.0
Phillip Island2 racesavg P6.0
Mugello3 racesavg P6.3
Lusail3 racesavg P6.7
Red Bull Ring3 racesavg P8.0
Silverstone2 racesavg P8.0
Assen3 racesavg P8.7
Termas3 racesavg P8.7
Misano3 racesavg P9.5
Le Mans3 racesavg P10.7

Moto2: all in the Dunlop era.

Moto3 68 races · 2012–2015

Dry / wet

More podiums in the dry (20.0% dry, 12.5% wet)

Win rate
Dry60 races10%(6 wins)
Wet8 races0%(0 wins)
Podium rate
Dry60 races20%(12 podiums)
Wet8 races13%(1 podiums)
Average finish (when classified)
Dry60 racesavg P6.9
Wet8 racesavg P10.8

By grid positionSmall sample

From Grid 10–15, they move up from an average grid of 12.2 to an average finish of 7.9

average grid average finish (classified)

15101520Starting Grid 1–3: average grid 2.3 → average finish 4.2 (15 races, 3 wins)Grid 1–3Starting Grid 4–6: average grid 5.1 → average finish 5.1 (15 races, 2 wins)Grid 4–6Starting Grid 7–9: average grid 8.1 → average finish 9.9 (15 races, 0 wins)Grid 7–9Starting Grid 10–15: average grid 12.2 → average finish 7.9 (12 races, 1 wins)Grid 10–15Starting Grid 16〜: average grid 19.5 → average finish 9.2 (11 races, 0 wins)Grid 16〜
Grid 1–32.3 → 4.23 wins / 15 races
Grid 4–65.1 → 5.12 wins / 15 races
Grid 7–98.1 → 9.90 wins / 15 races
Grid 10–1512.2 → 7.91 wins / 12 races
Grid 16〜19.5 → 9.20 wins / 11 races

By circuit (best average first)Small sample

Best circuit: Mugello (average P3.0, 4 races)

Mugello4 racesavg P3.0
Sepang4 racesavg P3.0
Termas1 racesavg P4.0
Motegi4 racesavg P4.3
Assen4 racesavg P4.5
Aragón4 racesavg P5.3
Valencia4 racesavg P6.3
Catalunya4 racesavg P6.5
Silverstone4 racesavg P8.0
Lusail4 racesavg P8.0
Brno4 racesavg P8.3
Indianapolis4 racesavg P8.5
Phillip Island4 racesavg P9.0
Le Mans4 racesavg P10.0
Misano4 racesavg P10.0
Jerez4 racesavg P10.7
Sachsenring3 racesavg P11.5
COTA3 racesavg P12.0
Estoril1 races—

Moto3: all in the Dunlop era.

125cc 11 races · 2011

Dry / wetSmall sample

Podium rate: 0.0% dry, 0.0% wet

Win rate
Dry10 races0%(0 wins)
Wet1 races0%(0 wins)
Podium rate
Dry10 races0%(0 podiums)
Wet1 races0%(0 podiums)
Average finish (when classified)
Dry10 racesavg P10.7
Wet1 races—

By grid positionSmall sample

average grid average finish (classified)

15101520Starting Grid 1–3: average grid 3.0 → average finish 7.0 (1 races, 0 wins)Grid 1–3Starting Grid 7–9: average grid 8.5 → average finish 10.0 (2 races, 0 wins)Grid 7–9Starting Grid 10–15: average grid 11.4 → average finish 8.8 (5 races, 0 wins)Grid 10–15Starting Grid 16〜: average grid 16.0 → average finish 23.0 (3 races, 0 wins)Grid 16〜
Grid 1–33.0 → 7.00 wins / 1 races
Grid 7–98.5 → 10.00 wins / 2 races
Grid 10–1511.4 → 8.80 wins / 5 races
Grid 16〜16.0 → 23.00 wins / 3 races

By circuit (best average first)Small sample

Best circuit: Estoril (average P7.0, 1 races)

Estoril1 racesavg P7.0
Mugello1 racesavg P8.0
Indianapolis1 racesavg P8.0
Le Mans1 racesavg P9.0
Misano1 racesavg P10.0
Lusail1 racesavg P10.0
Brno1 racesavg P23.0
Jerez1 races—
Catalunya1 races—
Sachsenring1 races—
Aragón1 races—

125cc: all in the Multiple suppliers era.

Fewer than 30 races: small sample (dashed). Average finish counts classified finishes only | Scope: official results DB, 2011–2025 (the rider's racing years)

Distance ridden and distance travelled

Counted from 1949 (lap lengths before 1998 researched from published sources: estimates)

Ridden on the bike

at least 16,139 miles
0.6× around the Earth · 5,580 laps

Time on the bike: at least 764 hours (31.8 days)
Average 150 km/h, top 361.2 km/h
Time and average speed only from 2011–2025, the seasons with every session's lap analysis

Travelled between circuits

at least 592,637 miles
23.8× around the Earth · at least 54.6 days

From 1949. Every session in the seasons with the lap analysis documents, races only before. Tests not included. Laps × that year's lap length.A minimum, calculated from straight-line distances between circuits. Connections, tests and trips home are not included, so the real figures are longer.

Every race

89.8%Start rate (246/274)
5Longest run of absences (races)
53Longest run of starts (races)
104.9Estimated points lost to absences
1Win3Podium8Points18No pointsRRetired–Absent 25top: sprint, bottom: race
2011 125cc P14 · 44 pts
2012 Moto3 P8 · 114 pts
2013 Moto3 P6 · 150 pts
2014 Moto3 P10 · 110 pts
2015 Moto3 P2 · 254 pts
2016 Moto2 P21 · 36 pts
2017 Moto2 P3 · 241 pts
2018 Moto2 P2 · 297 pts
2019 MotoGP P17 · 33 pts
2020 MotoGP P9 · 125 pts
2021 MotoGP P14 · 94 pts
2022 MotoGP P10 · 149 pts
2023 MotoGP P16 · 76 pts
2024 MotoGP P15 · 75 pts
2025 MotoGP P20 · 43 pts

Tap a cell for the event, qualifying, sprint and race results and points

? How the estimate is made

Estimate = average of the last 3 races before each absence

Seasons in which at least half of the races were started | Scope: official results DB, 2011–2025 (the rider's racing years)

Feedback and error reports

MotoRaceLab improves every day thanks to our readers' feedback. The editors read everything we receive, and changes we make are announced in the Changelog. If you wish, we will list your nickname on our Contributors page.

Type
Sent automatically
Page
Part of the page
Device

We do not ask for your e-mail or real name, and we do not store IP addresses.